Take control of data with Excel's business analytics tools
Today businesses are required to understand a growing amount of company market and social data to drive effective business decisions and remain comp...

Today, businesses are required to understand a growing amount of company, market and social data to drive effective business decisions and remain competitive. This trend of analytics everywhere is driving a shift in the roles of business consumers, as the need for direct data access, ad-hoc analyses and in-depth reporting is growing beyond the capacity of their IT departments. Many specialized business intelligence and analytics solutions are entering the market to take advantage of this trend with most requiring installation of new data systems or new training of employees to learn new tools. But if you look closely—Excel—the Office productivity tool you already know and love, may already have the business analytics tools you need to empower you to drive the information analyses and data-driven decisions critical to your business.

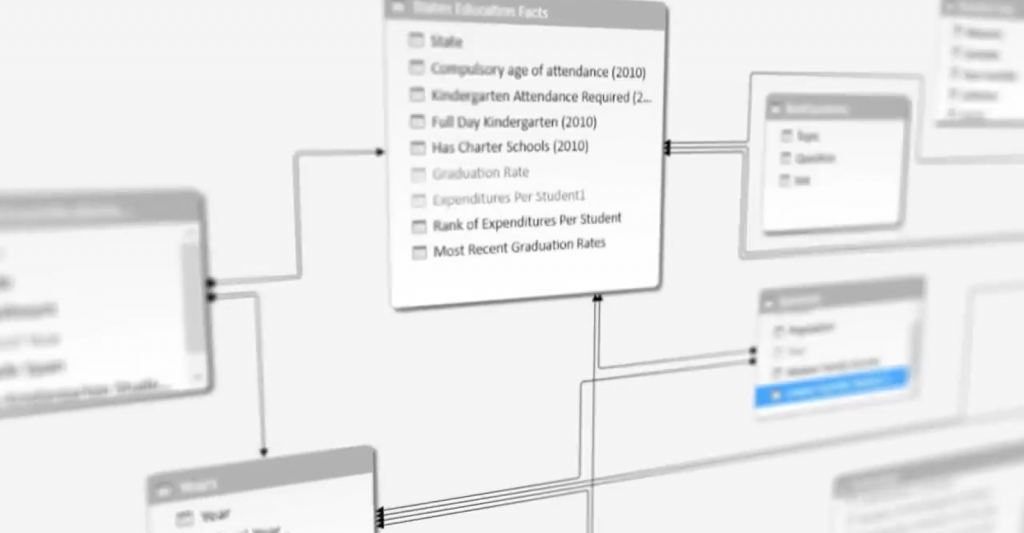
Building data models with drag-and-drop ease.
Starting with Office 2013, Excel comes with a suite of self-service analytics features that allow you to find, connect, shape, model and analyze your company data in intuitive ways. While the product has always been a powerful calculation device, today’s Excel comes with in-memory technology that allows it to support hundreds of millions of rows of business data with incredible performance—letting you do the necessary analysis without the need for using a database or waiting for IT to develop the models for you.
But like with most evolutions of a product, it can be hard to believe until you experience it for yourself. That is why we have provided innovative interactive tours that let you get a taste of each self-service analytics feature. In just one-click, these web-based tours put you in the driver’s seat of a demo without the need for installations or trial sign-ups. After taking the tours, the Excel for Business Analytics site provides you with the information you need to help get started using these features, whether you already have Excel 2013 or need to upgrade.
Check out all the tours available for you and start taking control of your data!
Get to all your data

Power Query for Excel helps you discover and bring all your data together so you can start analyzing in seconds. Connect to data from public data, on-premises data sources, Hadoop datasets, streaming data and cloud services. Use search inside Excel to find data around you. Then freely shape and merge data from multiple sources so you can analyze all within Excel.
Create sophisticated data models
 After connecting to your data, use Power Pivot for Excel to put it all together in sophisticated data models. This used to be something that only the IT department could do, but now you have the power to create models on your own desktop. Use the visual canvas to identify the relationships between the data tables and simply draw relationships to build your model.
Analyze with stealth and power

With Power Pivot for Excel, you can enhance your business data with custom calculated fields, hierarchies and KPIs to analyze in the way that makes most sense to your business needs. Best of all, still take advantage of familiar analysis tools, like Pivot Tables and Pivot Charts, but now with more power. Excel’s in-memory technology allows you to analyze hundreds of millions of rows of data.
Perform analysis across 3-D maps

With Power Map for Excel, perform geospatial explorations of your data by taking advantage of any data with location to plot across 3-D maps. Interact and story tell with this captivating map tool to see your data in new perspectives and unlock deeper insights.
The post Take control of data with Excel’s business analytics tools appeared first on Office Blogs.


